

It Might Be Easier to Predict the Champions League Winner Than Private Markets Returns
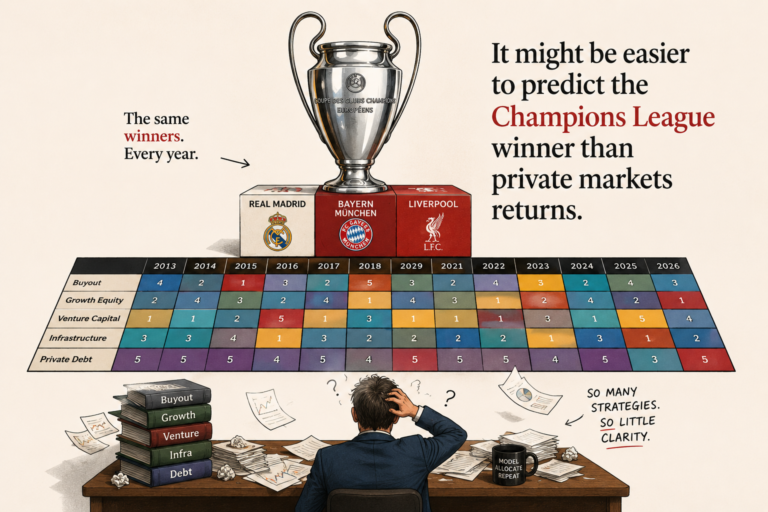
There is a moment, usually midway through a fundraising or investment conversation, when someone brings up the Hamilton Lane periodic table of returns.
It is raised with the quiet authority of something that ought to settle the discussion. Neatly arranged colours, vintage years marching across the page, strategies rising and falling in a pattern that looks, at first glance, almost scientific.
It is a reassuring chart. It suggests that private markets can be understood, perhaps even anticipated, if one is sufficiently diligent, almost cause and correlation.
It also has a habit of doing the opposite.
Summary
- Private markets returns are notoriously difficult to predict, with leadership rotating constantly across strategies and vintages
- The Champions League appears unpredictable at first glance, but outcomes quickly concentrate among a small group of clubs
- Real Madrid, Bayern Munich and Liverpool repeatedly reach the latter stages, suggesting structural advantages rather than randomness
- In private markets, diversification helps manage risk, but manager selection ultimately drives outperformance
- The comparison highlights an uncomfortable truth for LPs: identifying structural winners may be easier in football than in private markets
“The biggest risk is not volatility, but the illusion that we understand what drives outcomes.”
Howard Marks, Co-Founder, Oaktree
The chart that undermines conviction
Look at it for long enough and the order dissolves into movement. Strategies that lead one year drift down the table the next.
Late stage venture, in particular, seems to oscillate between brilliance and disappointment with unnerving speed. Buyout strategies move more slowly, but they move nonetheless. Infrastructure tends to sit somewhere in the middle, reliable but rarely dominant.
Chart 1: The Periodic Table of Returns
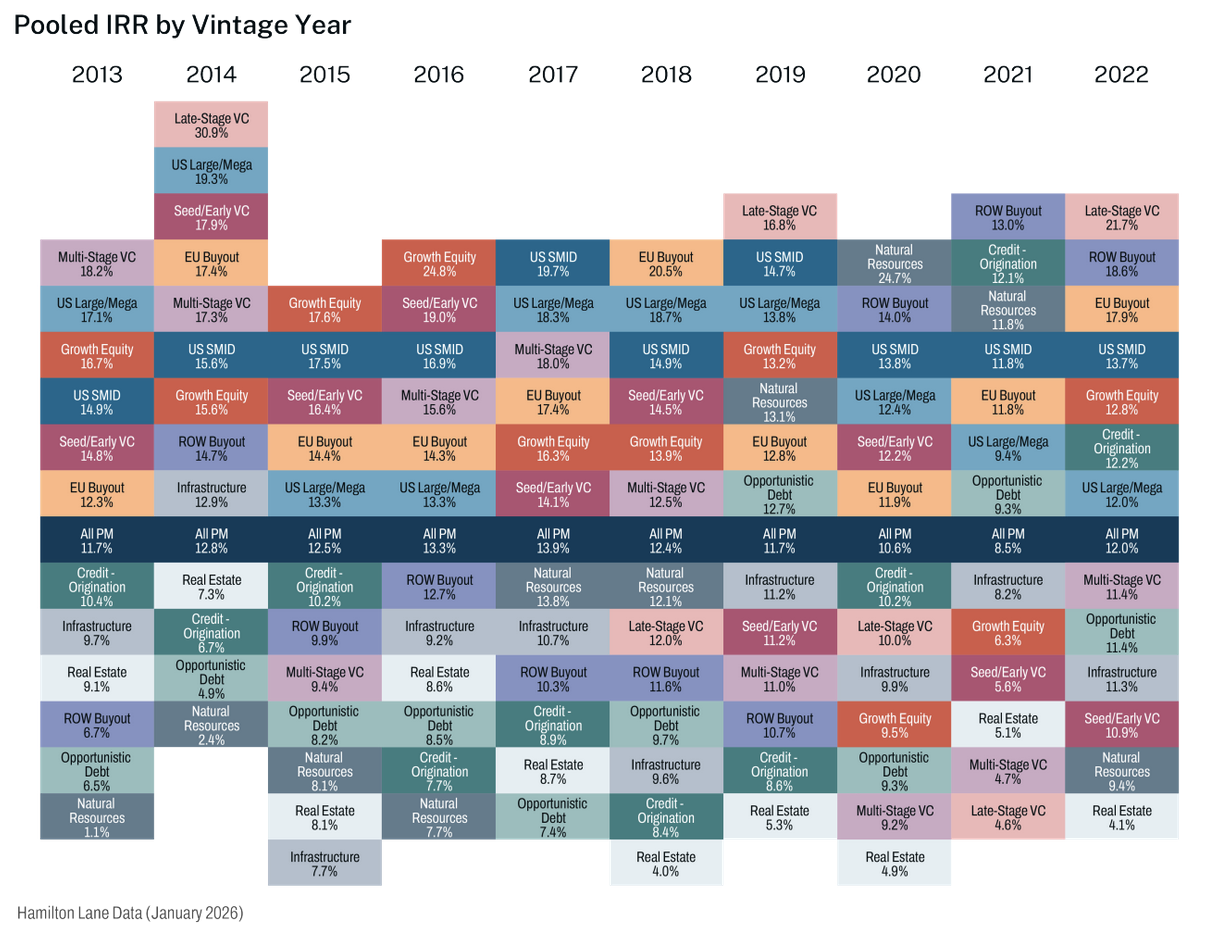
Source: Hamilton Lane, 2026
There are few disasters, which is comforting. But there is also very little persistence at the top.
That is the part investors tend not to dwell on – the difficulty in private markets is not avoiding loss at the strategy level. It is identifying, in advance, where outperformance will emerge.
The periodic table of returns offers little encouragement on that front. It shows dispersion, rotation, and a stubborn refusal to settle into anything resembling a stable hierarchy, i.e. one that aligns with otherwise neat, almost linear thinking of risk adjusted returns
For LPs, this creates a familiar tension. Diversification across private equity, private debt, growth, venture and infrastructure is sensible, even necessary. But diversification does not solve the central problem. It merely spreads the uncertainty more evenly.
Which is why the comparison with football is so uncomfortable.
A competition designed for unpredictability
If any system ought to resist prediction, it is the Champions League. Different leagues, different styles, different financial constraints, all brought together in a format that rewards moments as much as method. And, although increasingly tilted to the big clubs in the big five, a single poor performance can end a campaign; a fortunate draw can transform one.
At the level of participation, the competition behaves as expected with limited predictability.
Chart 2: The Champions League Last 16 – Broad Participation, Little Predictability
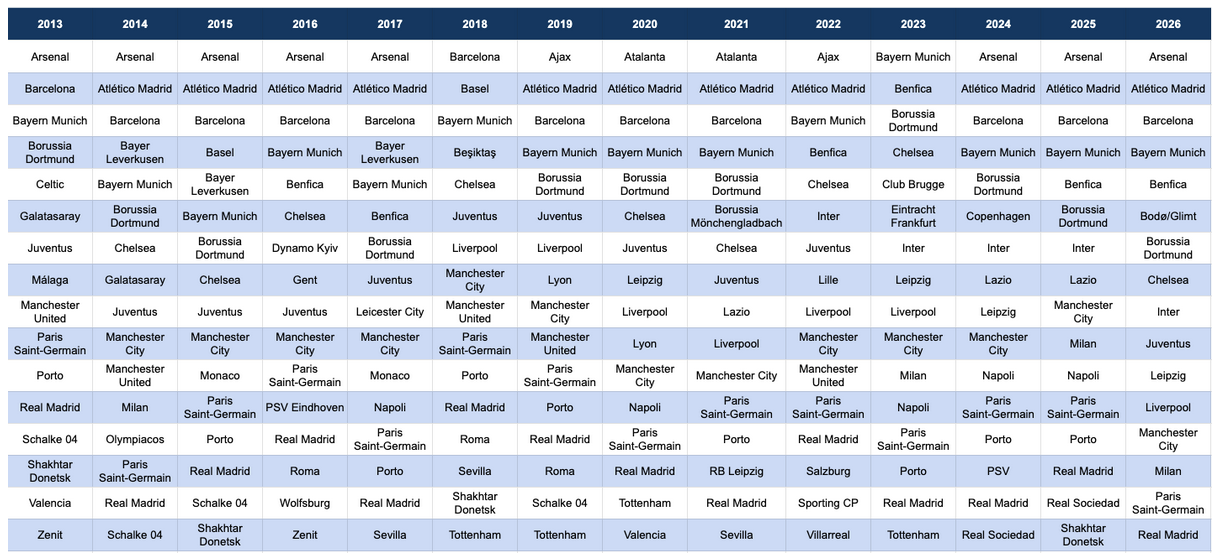
Source: Balentic, 2026
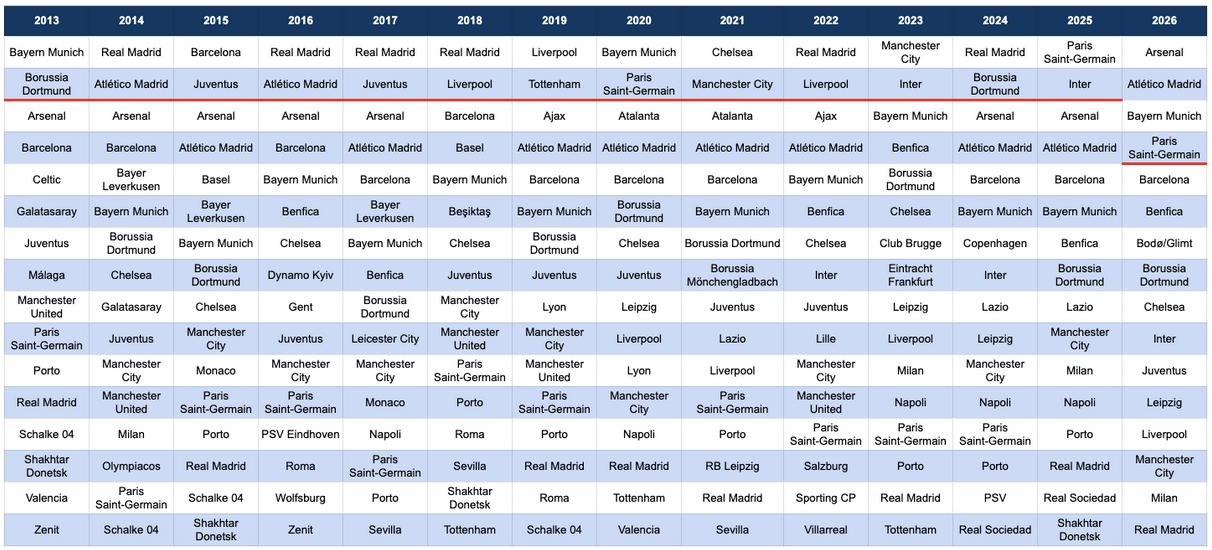
But, reorder the same data to focus on progression rather than participation, i.e. from the preliminary rounds to the Last 16, and something shifts. The noise does not disappear entirely, but it becomes secondary. What emerges, as can be seen in Table 2, in its place is repetition.
If one were to stop there, the analogy with private markets would feel complete. Many participants, some persistence, outcomes that resist easy prediction.
The problem is that this is not where outcomes are determined.
The point at which the pattern reveals itself
Reorder the data from Table 2 to focus on progression, in this case from the last sixteen to the last four, and something shifts. The noise does not disappear entirely, but it becomes secondary. What emerges in its place is repetition.
Chart 3: From Participation to Progression: Patterns Begin to Emerge
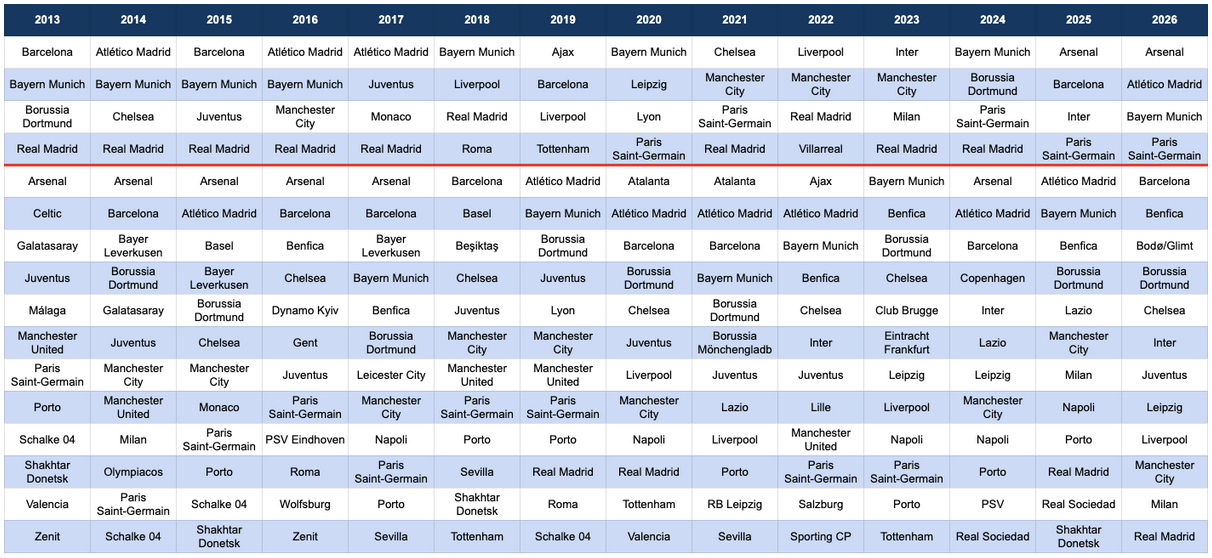
Source: Balentic, 2026
Certain clubs begin to appear with a frequency that is difficult to ignore.
Real Madrid. Bayern Munich. Liverpool. Barcelona.
Different squads, different managers, different moments in their respective cycles, yet the same names recur. Not occasionally, but persistently.
The field narrows far more quickly than it first appears. What looked like a broad competitive set, even among the Last 16, resolves into a much smaller group of consistent contenders.
This is the point at which the analogy with private markets becomes more than a curiosity.
Fundraising data, like participation in the Round of 16, suggests breadth. There are many managers, many strategies, and a steady flow of capital into the asset classes. But once realised performance is examined, the field contracts. The number of managers that consistently deliver strong outcomes is considerably smaller than the number that raise capital.
The difference between participation and progression matters.
At the very top, the illusion disappears
Focus only on finalists and winners, and the pattern is no longer open to interpretation.
A small number of clubs dominate the latter stages over time. Real Madrid’s record stands out, but they are not alone. Bayern Munich and Liverpool appear with a regularity that feels less like coincidence and more like structure.
Others break through. Occasionally they win. But they rarely remain.
Chart 4: At the Top, Outcomes Are Highly Concentrated
Source: Balentic, 2026
The instinctive explanation for concentration in football is money, and it is not entirely wrong. Financial resources create options. They allow clubs to recruit talent, invest in infrastructure, and absorb mistakes.
But money alone does not explain persistence. There are clubs with substantial resources that (almost systematically) fail to convert them into consistent success. There are others, operating with less, that repeatedly exceed expectations.
What distinguishes the consistent winners is not simply access to capital, but the ability to deploy it effectively over time. Recruitment, decision-making, institutional stability, and an embedded understanding of how to compete at the highest level all play a role.
In other words, outcomes are shaped by structure.
Private markets, by contrast, are influenced by forces that are harder to anchor. Entry valuations, macro conditions, financing environments, and timing all interact in ways that are difficult to predict and even harder to control. Strategies rotate not only because of skill, but because of cycle.
This does not eliminate the role of manager quality. It complicates it.
Structure, not randomness
The instinctive explanation for concentration in football is money, and it is not entirely wrong. Financial resources create options. They allow clubs to recruit talent, invest in infrastructure, and absorb mistakes.
But money alone does not explain persistence. There are clubs with substantial resources that (almost systematically) fail to convert them into consistent success. There are others, operating with less, that repeatedly exceed expectations.
What distinguishes the consistent winners is not simply access to capital, but the ability to deploy it effectively over time. Recruitment, decision-making, institutional stability, and an embedded understanding of how to compete at the highest level all play a role.
In other words, outcomes are shaped by structure.
Private markets, by contrast, are influenced by forces that are harder to anchor. Entry valuations, macro conditions, financing environments, and timing all interact in ways that are difficult to predict and even harder to control. Strategies rotate not only because of skill, but because of cycle.
This does not eliminate the role of manager quality. It complicates it.
What this means for limited partners
The periodic table encourages a particular way of thinking. It frames the problem as one of allocation. How much to commit to buyout, how much to venture, how much to private debt or infrastructure.
Those decisions matter. Cycles are real, and exposure needs to be managed.
But the Champions League analogy suggests that allocation, while necessary, is not sufficient.
The more consequential question is one of selection.
Within any given strategy, performance dispersion is meaningful. Some managers consistently find ways to outperform, even as conditions change. Others deliver acceptable, sometimes even strong, results in favourable environments, but fail to sustain them.
The difficulty lies in identifying which is which before the outcome is obvious.
There is a natural tendency to rely on proxies. Brand, scale, recent performance, fundraising momentum, benchmarks. These signals are not without value, but they are often misleading especially when taken in isolation.
In football, domestic league, league results, large wage bills and established reputations do not guarantee success. In private markets, large funds, well-known names, and past performance do not guarantee outperformance.
The distinction between appearance and structure matters.
The uncomfortable shift from allocation to judgement
This is where the problem becomes less comfortable. Allocation can be systematised. It can be justified with data, models, and historical analysis. It sits comfortably within institutional processes. And it can even to some extent be finetuned over time.
Selection is different. It is more art than science – it requires judgement. It involves forming a view on people, processes, and behaviours that are not always visible in headline numbers. It involves accepting that some of the most important drivers of outcome are qualitative, persistent, and not easily captured in a chart.
The Champions League makes this easier to see. Over time, certain clubs demonstrate an ability to operate at a level that others do not. That capability is not fully explained by resources, nor is it entirely reducible to individual decisions. It is seemingly deeply embedded in the club’s DNA.
Private markets have their equivalents. They are simply harder to identify in advance.
A system that looks competitive, but is not evenly distributed
What emerges from both sets of data is a distinction between appearance and reality.
Private markets appear diversified, and in many respects they are. The Champions League appears competitive, and at the level of participation it clearly is. But in both cases, outcomes tell a different story.
In football, success concentrates around a small number of structurally advantaged participants. In private markets, outperformance rotates across strategies, obscuring the underlying persistence of certain managers.
This is why the comparison is useful. It highlights not similarity, but contrast.
In one system, structural winners are visible, even if they do not win every year. In the other, structural winners exist, but are harder to isolate from the noise created by cycle and dispersion.
Which brings us back to the central idea.
It is easier to identify structural winners in football than in private markets.
Part two – the drivers of persistence
This first part has focused on recognising the pattern. The charts do not need to be explained at length; they need to be seen in the right order. Participation suggests randomness. Progression reveals structure and the outcomes confirm it.
In Part 2, which is arguably more for the football aficionados than the academically inclined LPs, the focus shifts from observation to explanation.
If certain clubs consistently convert resources into results, what does that process look like in practice? And what does it tell us about identifying the equivalent in private markets, where the signals are weaker and the consequences of misjudgement more persistent?
Because if the problem is not allocation, but selection, then the real work begins there.
Stay Illiquid!
Kasper
Sources
- Hamilton Lane, Periodic Table of Returns
- UEFA Champions League historical data
- Deloitte Football Money League
- Transfermarkt
- FBref
This article is provided for informational purposes only and does not constitute investment advice, legal advice, or a recommendation to buy or sell any security, financial instrument, or investment strategy. Nothing herein constitutes an offer or solicitation in any jurisdiction. Any references to investment strategies, market activity, or participants are illustrative and do not imply the availability of any investment opportunity. The content is not directed at retail investors. Where applicable, access to investment-related information is restricted to professional or institutional investors under relevant laws and regulations, including but not limited to Regulation D under the U.S. Securities Act of 1933, the EU Alternative Investment Fund Managers Directive (AIFMD), and the UK Financial Promotion Regime (COBS 4). Views expressed are those of the author(s) and may change without notice.

Balentic Edge
Sign up to keep up to date with the latest news and updates.
© 2025 Balentic ApS. CVR: 44034255. All rights reserved.
Privacy Policy | Terms of Service
The Balentic website and Orca are, and are expected to continue to be, under development. Consequently, some of the features described in this Overview and/or on the website may not yet be available or may work differently. Some features may furthermore not be available to all users.